- Home
- Councils
Councils league table · April to September 2026
How fast does your council pay its suppliers?
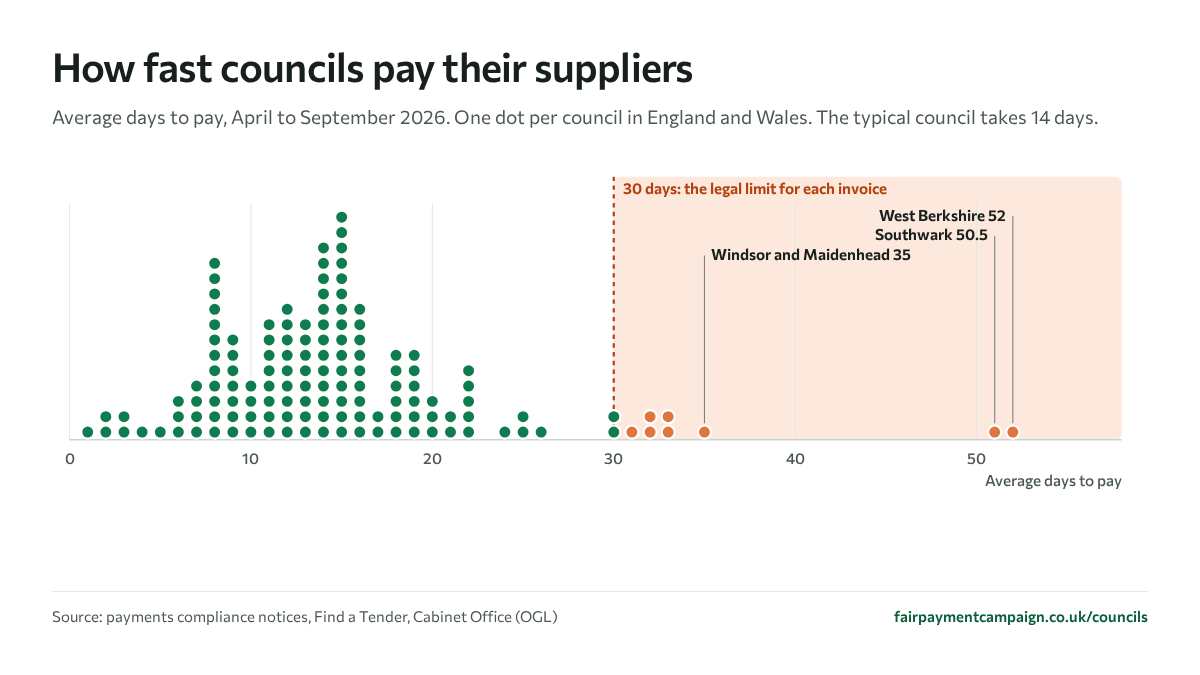
Since January, the law says a council must pay every undisputed invoice within 30 days, and publish how it did. We have put every council's figures in one place. The typical council takes 14 days. The slowest take more than 50.
14 daysTypical council's average time to pay, Apr to Sep 2026
95.5%Typical share of invoices paid within 30 days
8Councils whose average was longer than 30 days
171 of 339Councils we found no notice from for Apr to Sep 2026
Every council, one dot each
Average days to pay a supplier, April to September 2026. Most councils pay in two weeks. A handful take more than a month on average.
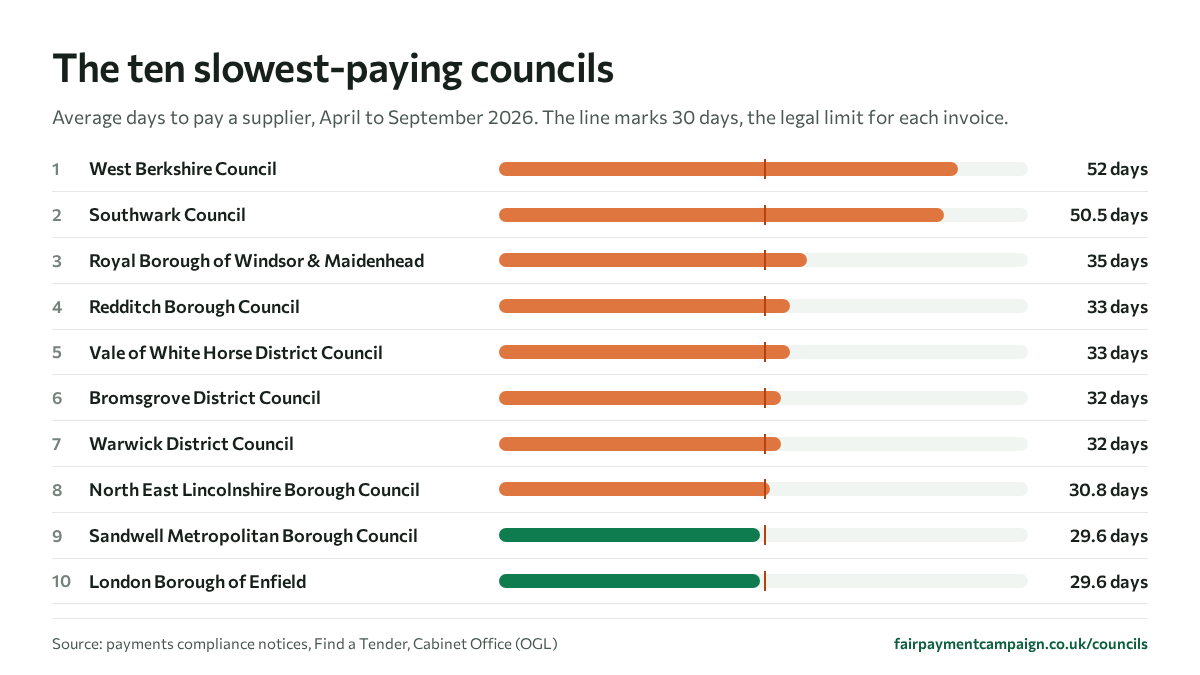
The ten slowest
The ten fastest
The thin line on each bar marks 30 days. Averages hide the tail: a council can average well under 30 days and still pay some invoices late, so the share paid within 30 days is shown too.
Nothing published
We found no notice from 171 councils for Apr to Sep 2026
Every council in England and Wales must publish a payments compliance notice on Find a Tender within 30 days of the end of each six-month period. For April to September 2026 that was 30 October. In the Find a Tender notice data published on data.gov.uk, to 13 November 2026, we found none for 171 of the 339 councils, and none for either period from 123.
If your council has published one we have missed, tell us at editor@fairpaymentcampaign.co.uk and we will add it the same day.
East Midlands 22
Amber Valley, Ashfield, Bassetlaw, Blaby, Bolsover, Broxtowe, Charnwood, Derby, Derbyshire, Erewash, Harborough, Hinckley and Bosworth, Lincoln, Mansfield, Melton, Newark and Sherwood, North East Derbyshire, North West Leicestershire, Oadby and Wigston, Rushcliffe, South Derbyshire, West Lindsey
East of England 17
Babergh, Basildon, Brentwood, Broxbourne, Colchester, Epping Forest, Fenland, Harlow, Maldon, Mid Suffolk, North Norfolk, Norwich, Rochford, Southend-on-Sea, St Albans, Three Rivers, Watford
London 18
Barking and Dagenham, Barnet, Bexley, Brent, Camden, Croydon, Ealing, Greenwich, Hammersmith and Fulham, Hillingdon, Islington, Kingston upon Thames, Lambeth, Lewisham, Merton, Redbridge, Waltham Forest, Wandsworth
North East 6
Darlington, Middlesbrough, North Tyneside, Northumberland, South Tyneside, Stockton-on-Tees
North West 18
Blackburn with Darwen, Bury, Knowsley, Lancashire, Lancaster, Manchester, Oldham, Pendle, Preston, Ribble Valley, Rochdale, Rossendale, South Ribble, St Helens, Stockport, Tameside, Trafford, Warrington
South East 44
Adur, Arun, Ashford, Bracknell Forest, Buckinghamshire, Canterbury, Cherwell, Chichester, Crawley, Eastbourne, Eastleigh, Elmbridge, Epsom and Ewell, Fareham, Gosport, Guildford, Hampshire, Havant, Horsham, Isle of Wight, Lewes, Maidstone, Medway, Portsmouth, Reading, Reigate and Banstead, Runnymede, Rushmoor, Sevenoaks, Slough, Spelthorne, Surrey Heath, Tandridge, Test Valley, Thanet, Tonbridge and Malling, Tunbridge Wells, Waverley, Wealden, West Oxfordshire, West Sussex, Winchester, Woking, Worthing
South West 17
Cheltenham, Cotswold, Devon, Forest of Dean, Gloucester, Gloucestershire, Isles of Scilly, North Devon, Plymouth, Somerset, South Gloucestershire, South Hams, Swindon, Teignbridge, Tewkesbury, West Devon, Wiltshire
Wales 10
Bridgend, Carmarthenshire, Conwy, Denbighshire, Flintshire, Merthyr Tydfil, Neath Port Talbot, Powys, Rhondda Cynon Taf, Swansea
West Midlands 12
Birmingham, Cannock Chase, Dudley, Newcastle-under-Lyme, North Warwickshire, Rugby, Shropshire, South Staffordshire, Stafford, Stoke-on-Trent, Stratford-on-Avon, Wyre Forest
Yorkshire and the Humber 7
Calderdale, Doncaster, Hull, North Lincolnshire, Sheffield, Wakefield, York
By region
Typical council's average days to pay, where at least three councils reported.
Getting slower, getting faster
Change in average days on the previous notice, for councils that reported all payments both times. 56 got slower and 44 faster.
Some first notices cover only January to March 2026, when the duty began, so a change can partly reflect the shorter period.
The full league table
137 councils that reported all their payments for April to September 2026, slowest first. Search or sort any column.
| # | Council | Region | Average days | Within 30 days | Payment bands | Change |
|---|---|---|---|---|---|---|
| 1 | West Berkshire Council | South East | 52 | 81% | ||
| 2 | Southwark Council | London | 50.5 | 77.5% | -10.7 | |
| 3 | Royal Borough of Windsor & Maidenhead | South East | 35 | 77% | -13 | |
| 4 | Redditch Borough Council | West Midlands | 33 | 75.5% | ||
| 5 | Vale of White Horse District Council | South East | 33 | 85% | +5 | |
| 6 | Bromsgrove District Council | West Midlands | 32 | 70.9% | ||
| 7 | Warwick District Council | West Midlands | 32 | 75.2% | +1 | |
| 8 | North East Lincolnshire Borough Council | Yorkshire and the Humber | 30.8 | 81.2% | -1.3 | |
| 9 | Sandwell Metropolitan Borough Council | West Midlands | 29.6 | 73.3% | +9.6 | |
| 10 | London Borough of Enfield | London | 29.6 | 98.4% | +20.1 | |
| 11 | Nottingham City Council | East Midlands | 26 | 59.3% | +2 | |
| 12 | Leicester City Council | East Midlands | 25 | 79.3% | +4 | |
| 13 | Leicestershire County Council | East Midlands | 24.6 | 90.3% | -0.4 | |
| 14 | Southampton City Council | South East | 24 | 95.5% | ||
| 15 | Halton Borough Council | North West | 22.3 | 91.6% | +2.5 | |
| 16 | Cyngor Gwynedd | Wales | 22.2 | 85.2% | ||
| 17 | Wigan Council | North West | 22 | 82% | -2 | |
| 18 | Bristol City Council | South West | 22 | 92% | 0 | |
| 19 | Sefton Metropolitan Borough Council | North West | 22 | 95% | +1 | |
| 20 | Chesterfield Borough Council | East Midlands | 21.1 | 91.1% | +1.4 | |
| 21 | Pembrokeshire County Council | Wales | 21 | 86% | ||
| 22 | Basingstoke and Deane Borough Council | South East | 20.4 | 94.8% | +2.8 | |
| 23 | Nuneaton and Bedworth Borough Council | West Midlands | 20 | 89.4% | +3 | |
| 24 | Nottinghamshire County Council | East Midlands | 20 | 90% | 0 | |
| 25 | Cornwall Council | South West | 19 | 87% | -6 | |
| 26 | London Borough of Tower Hamlets | London | 19 | 91.6% | -1 | |
| 27 | Boston Borough Council | East Midlands | 19 | 94.8% | +2 | |
| 28 | Liverpool City Council | North West | 19 | 97.5% | +2 | |
| 29 | Dacorum Borough Council | East of England | 18.8 | 96.2% | +0.5 | |
| 30 | Hertfordshire County Council | East of England | 18.5 | 91% | +1.6 | |
| 31 | Wyre Borough Council | North West | 18.4 | 94% | +6.8 | |
| 32 | Westmorland and Furness Council | North West | 18.3 | 92% | +13.6 | |
| 33 | The Council of the Borough of Kirklees | Yorkshire and the Humber | 18 | 94.1% | -1 | |
| 34 | Cheshire West and Chester Council | North West | 18 | 96.6% | +1.1 | |
| 35 | East Hampshire District Council | South East | 17.9 | 97.6% | ||
| 36 | Cheshire East Council | North West | 17.7 | 93% | +0.9 | |
| 37 | Brighton and Hove City Council | South East | 17.1 | 94.3% | +0.1 | |
| 38 | Lincolnshire County Council | East Midlands | 17.1 | 94.8% | +0.5 | |
| 39 | Cambridge City Council | East of England | 16.4 | 89.5% | ||
| 40 | Bedford Borough Council | East of England | 16.4 | 96% | +8.5 | |
| 41 | Redcar and Cleveland Borough Council | North East | 16.2 | 98.5% | -0.8 | |
| 42 | Monmouthshire County Council | Wales | 16.1 | 85.7% | ||
| 43 | East Hertfordshire District Council | East of England | 16.1 | 89.6% | 0 | |
| 44 | Oxford City Council | South East | 16 | 82% | -1 | |
| 45 | Essex County Council | East of England | 16 | 97.8% | +0.3 | |
| 46 | Malvern Hills District Council | West Midlands | 16 | 97.9% | -1 | |
| 47 | South Kesteven District Council | East Midlands | 15.9 | 97.4% | ||
| 48 | Blaenau Gwent County Borough Council | Wales | 15.4 | 87.6% | ||
| 49 | Welwyn Hatfield Borough Council | East of England | 15.4 | 97.9% | +2.7 | |
| 50 | Suffolk County Council | East of England | 15.2 | 97.4% | +1.1 | |
| 51 | Broadland District Council | East of England | 15.1 | 96.1% | +1.1 | |
| 52 | Burnley Borough Council | North West | 15 | 89.3% | +1 | |
| 53 | South Oxfordshire District Council | South East | 15 | 92% | -7 | |
| 54 | Peterborough City Council | East of England | 15 | 92.3% | -1 | |
| 55 | London Borough | London | 15 | 92.5% | ||
| 56 | East Riding of Yorkshire Council | Yorkshire and the Humber | 15 | 94% | 0 | |
| 57 | Tendring District Council | East of England | 15 | 95% | -3 | |
| 58 | London Borough of Newham | London | 15 | 96.3% | +7 | |
| 59 | East Lindsey District Council | East Midlands | 15 | 97.3% | +1 | |
| 60 | South Holland District Council | East Midlands | 15 | 97.9% | +1 | |
| 61 | Worcester City Council | West Midlands | 14.8 | 95.5% | -2.7 | |
| 62 | Hastings Borough Council | South East | 14.7 | 91.1% | +3.7 | |
| 63 | London Borough of Haringey | London | 14.4 | 91% | ||
| 64 | Warwickshire County Council | West Midlands | 14.4 | 96.1% | ||
| 65 | Bournemouth, Christchurch and Poole Council | South West | 14.3 | 94.4% | +0.4 | |
| 66 | Hyndburn Borough Council | North West | 14.3 | 97.9% | +0.5 | |
| 67 | Herefordshire Council | West Midlands | 14.2 | 97.4% | +0.7 | |
| 68 | London Borough of Richmond Upon Thames | London | 14 | 89.2% | -5 | |
| 69 | Hart District Council | South East | 14 | 93.4% | -1 | |
| 70 | New Forest District Council | South East | 14 | 96.6% | -1.4 | |
| 71 | South Norfolk Council | East of England | 14 | 97.5% | -2 | |
| 72 | Milton Keynes City Council | South East | 14 | 99.2% | -1 | |
| 73 | North Northamptonshire Council | East Midlands | 13.9 | 99.1% | -0.4 | |
| 74 | Rother District Council | South East | 13.8 | 97% | +2 | |
| 75 | Durham County Council | North East | 13.6 | 96.1% | +2.3 | |
| 76 | Castle Point Borough Council | East of England | 13.4 | 95.4% | -3.6 | |
| 77 | Stevenage Borough Council | East of England | 13.4 | 95.7% | ||
| 78 | Gravesham Borough Council | South East | 13.2 | 99.9% | +1.4 | |
| 79 | Rotherham Borough Council | Yorkshire and the Humber | 13.1 | 92.6% | +0.7 | |
| 80 | Walsall Council | West Midlands | 13 | 95.9% | +2 | |
| 81 | Surrey County Council | South East | 13 | 97% | 0 | |
| 82 | Great Yarmouth Borough Council | East of England | 13 | 97.4% | 0 | |
| 83 | West Northamptonshire Council | East Midlands | 13 | 98.8% | +1 | |
| 84 | Isle of Anglesey County Council | Wales | 12.3 | 90.8% | ||
| 85 | Cambridgeshire County Council | East of England | 12.3 | 98.8% | -0.7 | |
| 86 | Norfolk County Council | East of England | 12.2 | 98.1% | +1.3 | |
| 87 | Blackpool Borough Council | North West | 12 | 90% | -1 | |
| 88 | Hartlepool Borough Council | North East | 12 | 97% | 0 | |
| 89 | Newport City Council | Wales | 12 | 97% | ||
| 90 | Torbay Council | South West | 11.7 | 92.3% | -0.3 | |
| 91 | Barnsley Metropolitan Borough Council | Yorkshire and the Humber | 11.5 | 92.2% | +1.9 | |
| 92 | Bolton Metropolitan Borough Council | North West | 11.5 | 97% | -1.9 | |
| 93 | Braintree District Council | East of England | 11.4 | 94.8% | +1.7 | |
| 94 | Chorley Council | North West | 11 | 85.8% | +1 | |
| 95 | Solihull Metropolitan Borough Council | West Midlands | 11 | 94.5% | +2 | |
| 96 | Bath & North East Somerset Council | South West | 11 | 95% | 0 | |
| 97 | Coventry City Council | West Midlands | 11 | 96.1% | 0 | |
| 98 | Wychavon District Council | West Midlands | 11 | 98% | +2 | |
| 99 | North Kesteven District Council | East Midlands | 10.8 | 95.5% | -0.5 | |
| 100 | Sunderland City Council | North East | 10.5 | 96.3% | +0.9 | |
| 101 | East Suffolk Council | East of England | 10 | 96% | 0 | |
| 102 | Huntingdonshire District Council | East of England | 10 | 99.4% | +0.5 | |
| 103 | Wokingham Borough Council | South East | 9.6 | 95.3% | -6.9 | |
| 104 | Caerphilly County Borough Council | Wales | 9.6 | 97.9% | ||
| 105 | Newcastle City Council | North East | 9.4 | 97.2% | -1.3 | |
| 106 | Cumberland Council | North West | 9 | 91.2% | 0 | |
| 107 | Cyngor Sir Ceredigion County Council | Wales | 9 | 93.5% | ||
| 108 | Torridge District Council | South West | 9 | 96.8% | +0.4 | |
| 109 | Wrexham County Borough Council | Wales | 9 | 99% | ||
| 110 | West Lancashire Borough Council | North West | 8.8 | 97.8% | -6.6 | |
| 111 | The North Yorkshire Council | Yorkshire and the Humber | 8.8 | 98.3% | +4.1 | |
| 112 | London Borough of Havering | London | 8.4 | 96.7% | -0.5 | |
| 113 | Staffordshire County Council | West Midlands | 8.3 | 97.9% | -0.6 | |
| 114 | The District Council of Folkestone and Hythe | South East | 8.2 | 94.3% | -1.6 | |
| 115 | Gateshead Borough Council | North East | 8.2 | 96.7% | 0 | |
| 116 | Worcestershire County Council | West Midlands | 8 | 93% | +1 | |
| 117 | London Borough of Harrow | London | 8 | 95.5% | -2 | |
| 118 | South Cambridgeshire District Council | East of England | 8 | 95.7% | 0 | |
| 119 | East Sussex County Council | South East | 8 | 97% | +1 | |
| 120 | Hertsmere Borough Council | East of England | 7.9 | 97.2% | -0.6 | |
| 121 | East Devon District Council | South West | 7.8 | 95.1% | ||
| 122 | Royal Borough of Kensington and Chelsea | London | 7.8 | 96% | -34.8 | |
| 123 | Borough of Telford & Wrekin | West Midlands | 7.7 | 97% | ||
| 124 | Wolverhampton City Council | West Midlands | 7.4 | 95.5% | -2.7 | |
| 125 | Breckland District Council | East of England | 7.2 | 97.8% | -0.5 | |
| 126 | City of Bradford Metropolitan District Council | Yorkshire and the Humber | 7.1 | 97.5% | +1.5 | |
| 127 | East Cambridgeshire District Council | East of England | 6.8 | 99.3% | -0.5 | |
| 128 | Mid Sussex District Council | South East | 6.4 | 100% | +0.4 | |
| 129 | Stroud District Council | South West | 6.1 | 84.5% | ||
| 130 | Dartford Borough Council | South East | 6.1 | 99.3% | -0.4 | |
| 131 | London Borough of Bromley | London | 5 | 99% | -2 | |
| 132 | Fylde Borough Council | North West | 4.1 | 97.3% | +0.6 | |
| 133 | Salford City Council | North West | 3.4 | 99.3% | -0.2 | |
| 134 | Westminster City Council | London | 2.7 | 98.5% | -3.7 | |
| 135 | Oxfordshire County Council | South East | 2.1 | 99.5% | +0.2 | |
| 136 | London Borough of Hackney | London | 1.6 | 99.4% | -2.1 | |
| 137 | Vale of Glamorgan Council | Wales | 1 | 99.7% |
- Within 30 days
- 31 to 60 days
- Over 60 days
29 councils reported only their larger contracts
These notices cover only payments under contracts above the procurement thresholds, so they are not ranked against councils that reported everything.
- Luton Council 30 days, 99% within 30
- Cardiff Council 29 days, 99.7% within 30
- Leeds City Council 25.1 days, 94.8% within 30
- West Suffolk Council 24.7 days, 91.1% within 30
- Staffordshire Moorlands District Council 24.6 days, 98% within 30
- Gedling Borough Council 24.4 days, 100% within 30
- Ipswich Borough Council 24 days, 96% within 30
- High Peak Borough Council 23.3 days, 97.8% within 30
- North Hertfordshire District Council 22 days, 94.7% within 30
- North Somerset Council 19 days, 85.2% within 30
- Rutland County Council 18.8 days, 93.1% within 30
- Dover District Council 18 days, 95% within 30
- Exeter City Council 17 days, 88.2% within 30
- Dorset Council 16.7 days, 90.9% within 30
- Chelmsford City Council 15.7 days, 87% within 30
- Mole Valley District Council 15.7 days, 95.6% within 30
- Kent County Council 15.3 days, 93.8% within 30
- Swale Borough Council 15 days, 93% within 30
- Wirral Council 13 days, 95% within 30
- Thurrock Council 11 days, 95% within 30
- Derbyshire Dales District Council 8.7 days, 100% within 30
- London Borough of Hounslow 8.3 days, 97.9% within 30
- Uttlesford District Council 7.8 days, 100% within 30
- Torfaen County Borough Council 7.6 days, 96% within 30
- East Staffordshire Borough Council 7 days, 100% within 30
- King's Lynn and West Norfolk Borough Council 4.6 days, 100% within 30
- Lichfield District Council 4.2 days, 100% within 30
- Central Bedfordshire Council 4 days, 99.8% within 30
- London Borough of Sutton 4 days, 100% within 30
What the law says
Pay within 30 days. Under section 68 of the Procurement Act 2023, a council must pay an undisputed invoice within 30 days of receiving it, and the same term passes down its supply chain.
Publish every six months. Section 69 requires a payments compliance notice for each period ending 31 March and 30 September, within 30 days, on Find a Tender.
What is counted. The average days from receiving an invoice to paying it, and the share of payments made within 30 days, in 31 to 60 days and after 60 days.
Scotland and Northern Ireland. Scottish councils report under Scottish procurement rules and Northern Ireland's councils are exempt, so neither is in this table.
Figures are as each council published them; they are not audited, and councils may count slightly differently. A notice published to correct an earlier one replaces it. Source: payments compliance notices, Find a Tender, Cabinet Office, used under the Open Government Licence v3. Notices to 13 November 2026. Download every council as a CSV.
Charts and data for your story
Free for newsrooms, councils and anyone writing about local government. Please credit Fair Payment and link to this page.
Every council as a CSV, with links to each notice. Journalists: for a council's figures or a comment, email editor@fairpaymentcampaign.co.uk.